
Analytics
Written by Alyssa Jones 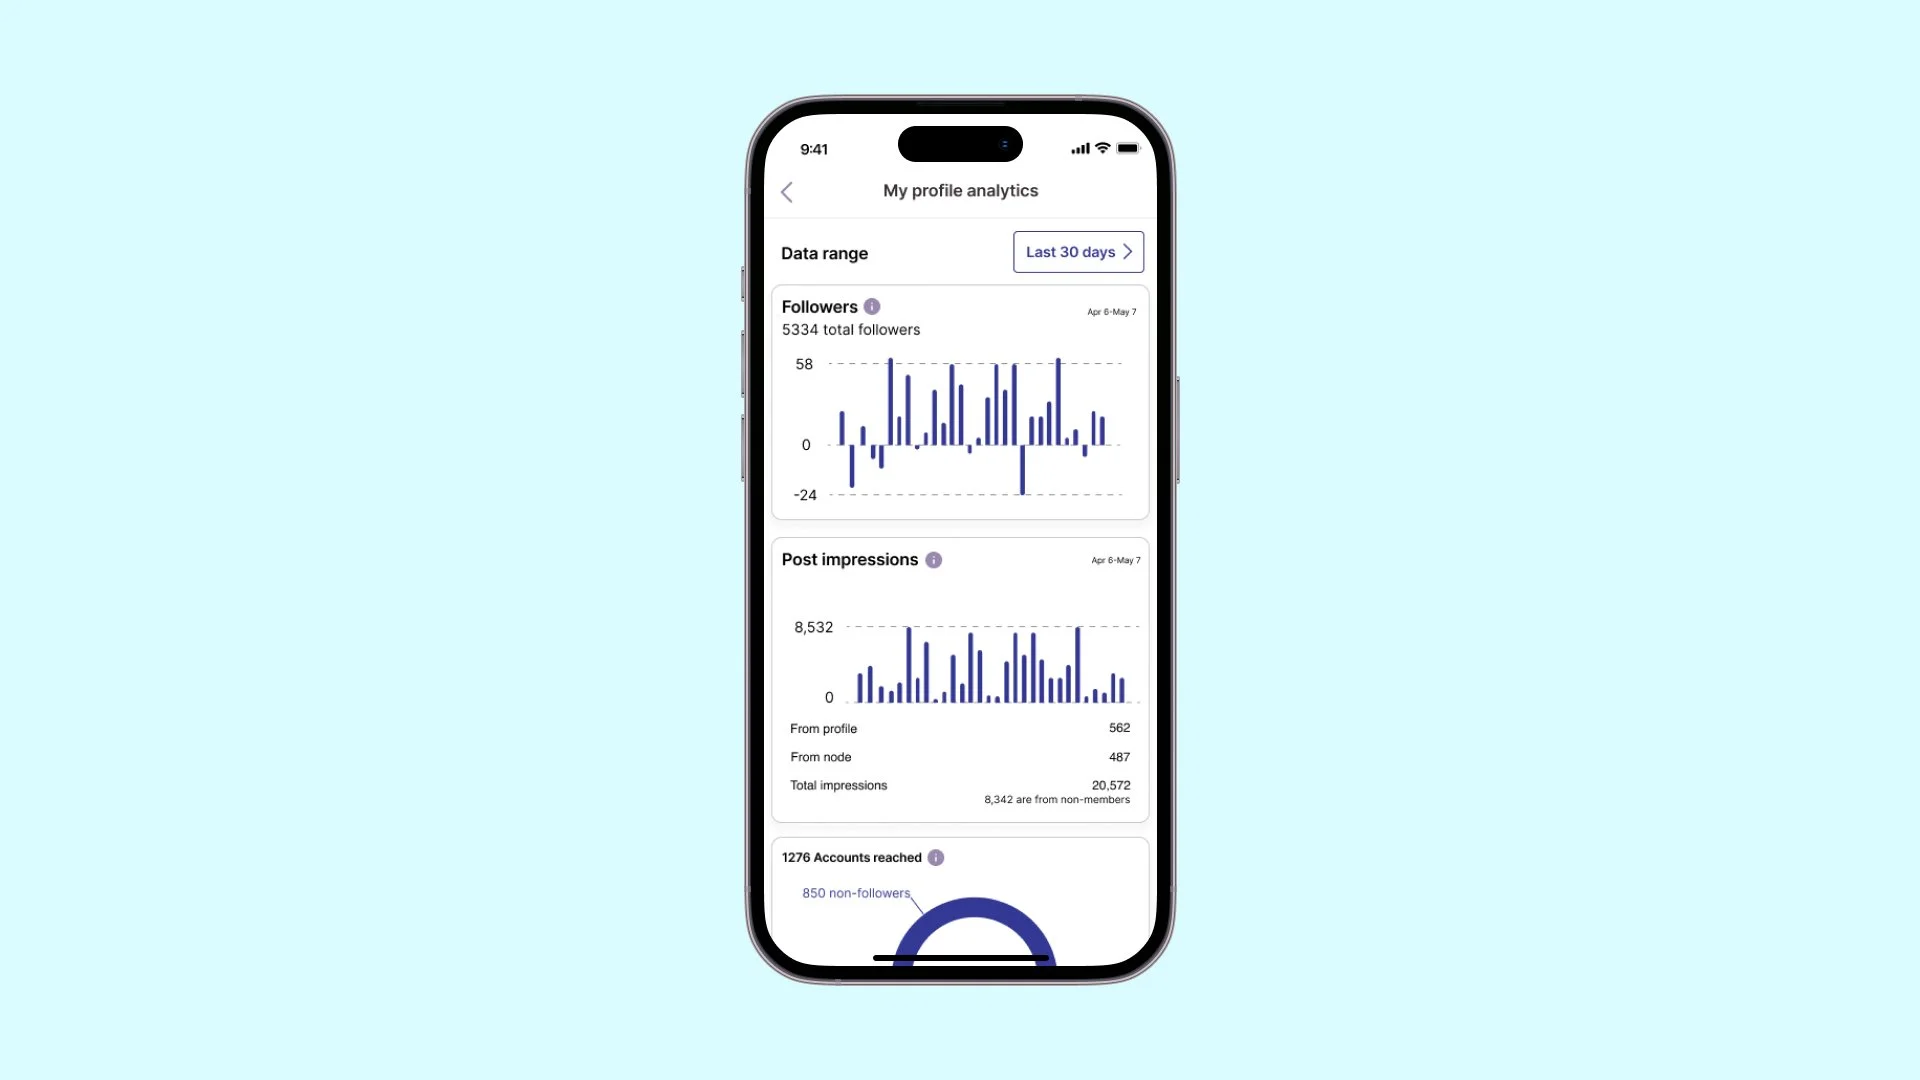
Summary
My role
UX Researcher and Lead Designer
About this project
The Mesh dashboard is meant to create a scalable feature that allows users the ability to gain insights to key analytics and demystify the quanitfiers that come together to make social media profitable for creators. By creating the guidelines for transparency and outlining KPIs for success within the mesh ecosystem, we empower content creators to make the most of their audience on mesh and, ultimately, bridge the gap between their earnings on the platform and the value of the communities they have spent so much time and energy cultivating. By providing more transparency to community creators, we can empower them to take control of their social media presence and increase their earnings on Mesh and within the broader social media industry. Exposing creators to greater earning possibilities is one of many key steps to accomplishing our goal of giving community builders a more impactful voice in the social media economy.
The Problem
Other platforms provide ways for communities to connect. But there are three key problems our competitors have not been effectively facing:
Community leaders lack the versatile moderation tools required to keep their communities safe and secure.
Most communities don’t have a way to maximize the monetization of their work - it’s treated as a thankless duty. But communities need access to the resources they generate for large platforms.
Most platforms misuse communities and their data for profit and give very little back
As it stands, the major social media platforms make billions of dollars from the direct efforts of the community builders on these platforms. Of those billions, creators often see less than 1% of these earnings. A combination of factors including (but not limited to), a lack of transparency when it comes to overall campaign earnings, shady algorithms that shadowban users to create false scarcity within the platform, and perplexing analytics leave community cultivators in the dark as to how much they should be earning from their hard work. We want to change this.
To solve this problem, I created the Mesh Analytics dashboard which allows users to view the performance of their posts, the engagement of their followers and/or members within their nodes, and the success of their advertising campaigns. Dashboards will display member, follower, content, and monetization data for review by Mesh Users. Users will also be able to export their data from these dashboards.
Research
Competitive analysis
Summary
It’s relatively well-known that all major social media platforms provide analytics suites for their professional users to reference their performance. While most of these analytics suites contain the same performance indicators, few clearly state how creators can maximize their potential on these platforms to consistently increase their earnings. Often, this gap is filled by a subset of creators who take on the task of publicly sharing guerilla methods they’ve employed to increase their numbers; however, there’s seldom an easily accessible central hub that teaches creators how to sufficiently use the platform while maintaining individuality. In a perfect world, when creators generate more money for the platforms, they should also expect to receive more pay. With this in mind, I took on the task of synthesizing the best of the best from each analytics suite to create a tool that creators can use to see their performance stats over time and improve future performance. My competitors are as follows:
Facebook- This social media powerhouse took the internet by storm nearly two decades ago, boasting a platform that could help you keep in touch with friends and family no matter where you are. Since its inception, Facebook has grown to become one of the largest community platforms and earns a huge share of ad revenue, largely through the efforts of creators and influencers. The downside of Facebook is that, as an older platform, they have made many trust and safety mistakes along the way that alienated more innovative users and irreversibly damaged confidence. Because of this, many individuals continue to move on to newer platforms in search of a haven to create and earn.
Instagram- As part of the Meta (Facebook) ecosystem, Instagram has all but cemented itself as one of the largest cutting-edge social tools for individual creators and influencers. The upside is that, because it is so widely used, Instagram facilitates connection with nearly any target audience a creator could hope to reach. However, Instagram was not built for communities, so its individualistic approach leaves its internal market saturated with users who are forced to chase ever-changing trends in a massively oversaturated ecosystem which makes it hard to tap into vital feedback that could improve current trends and innovate new ones.
TikTok- With the rise and fall of Vine and Facebook’s decline in popularity among younger audiences, TikTok has become a go-to for video content creators to express their opinions, share information, and engage with their audiences. this application features an addictive UI with one of the most intelligent content suggestion algorithms to date. Sadly, TikTok does not lend itself to more text-based content and, though its Stitch feature allows creators to explore 1-to-1 interactions, Yet again, this platform does not do a great job of fostering many-to-many interactions outside of comment threads.
SWOT Analysis
Key takeaways:
Industry-standard analytics options and layout
Gamifies major milestones and profile-building actions with the use of levels and reward
Large offering of peripheral tools in addition to industry standard analytics
Segmented to provide clear separation between Insights, tools, and tips
Content previews
The most relevant tips highlighted for easy access
TikTok
Key takeaways:
The most important metrics are prioritized
Inspiration posts available
Viewer rankings
Follow suggestions
Content and follower information tabbed for clear separation
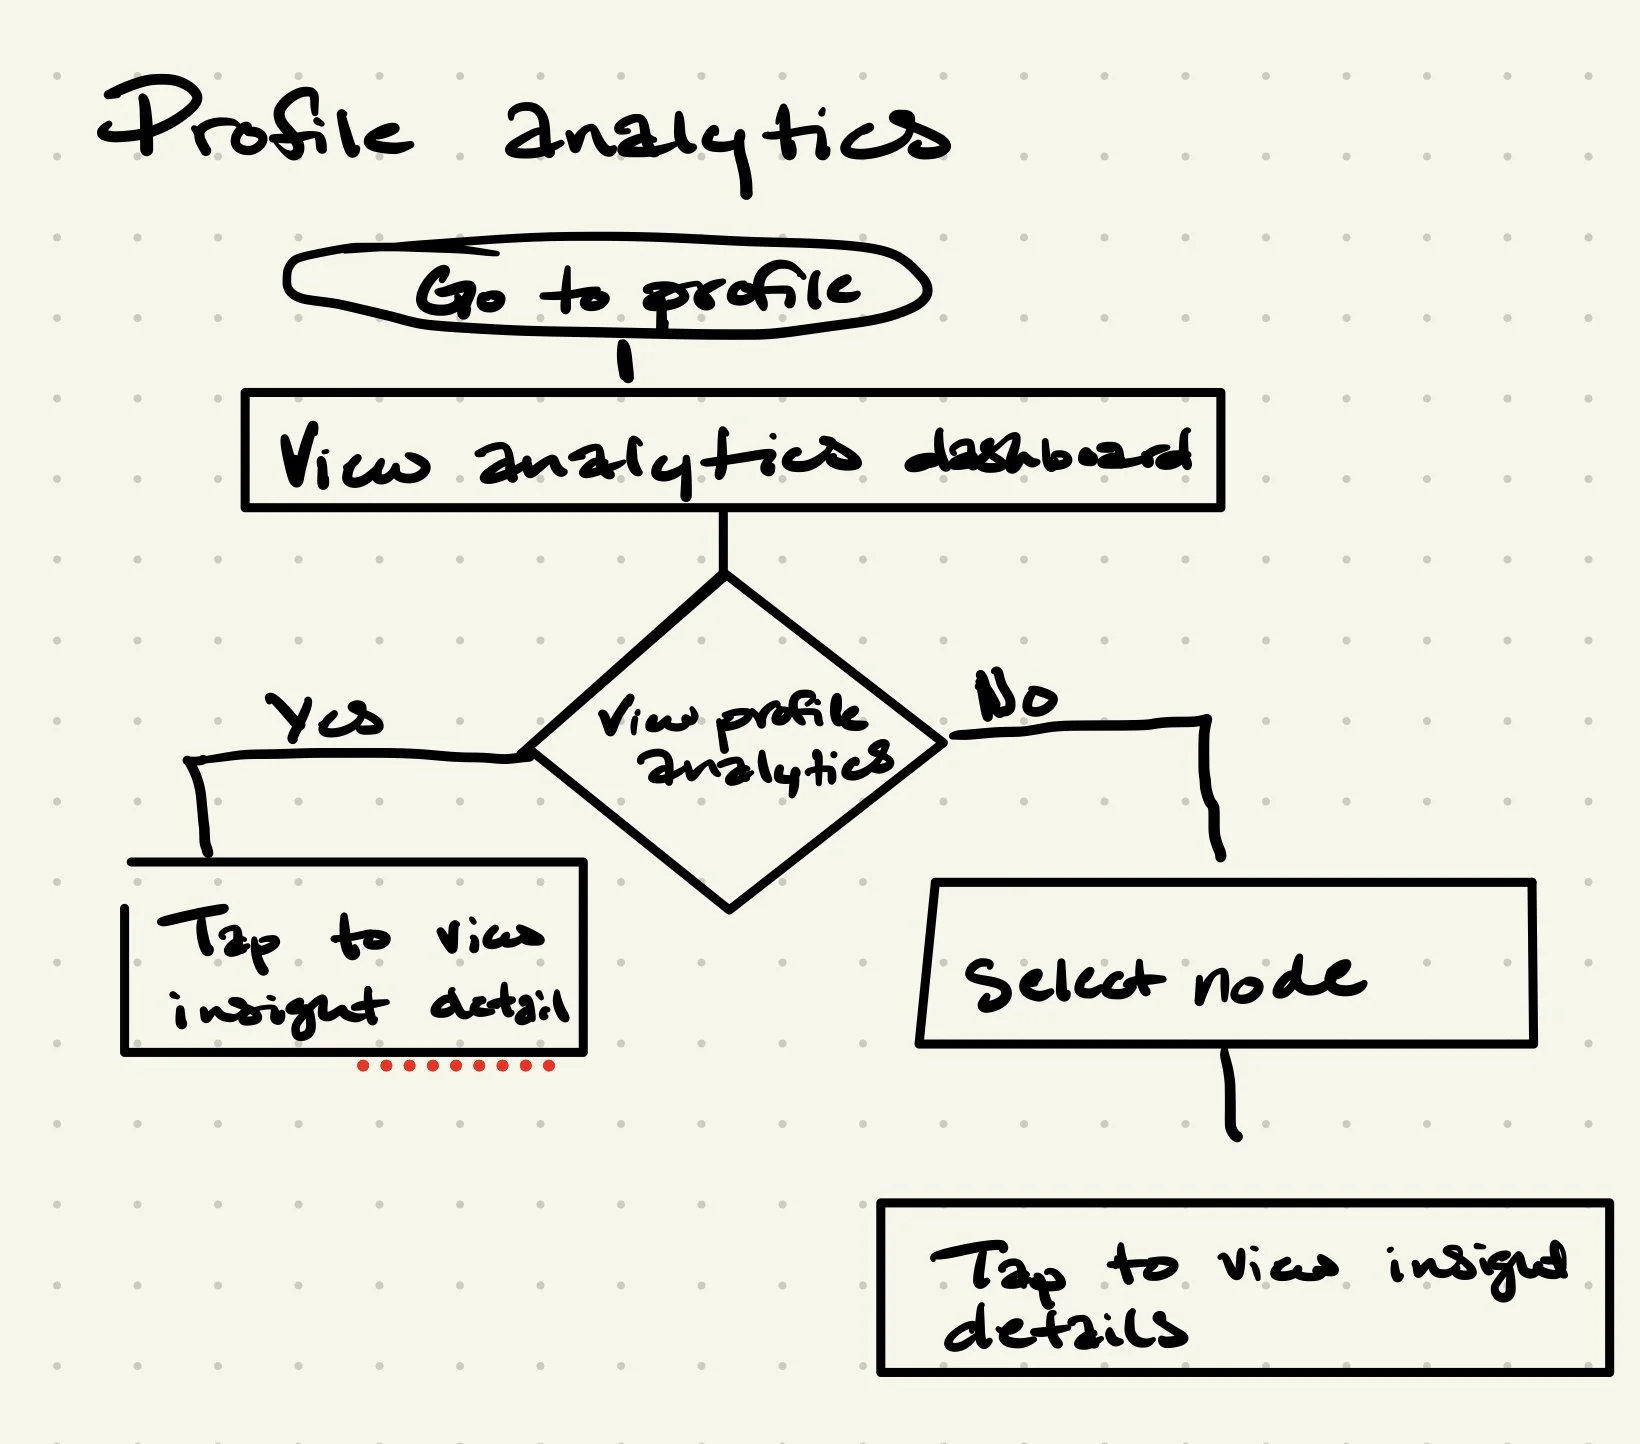
User Flow
User Personas
Jason Charles
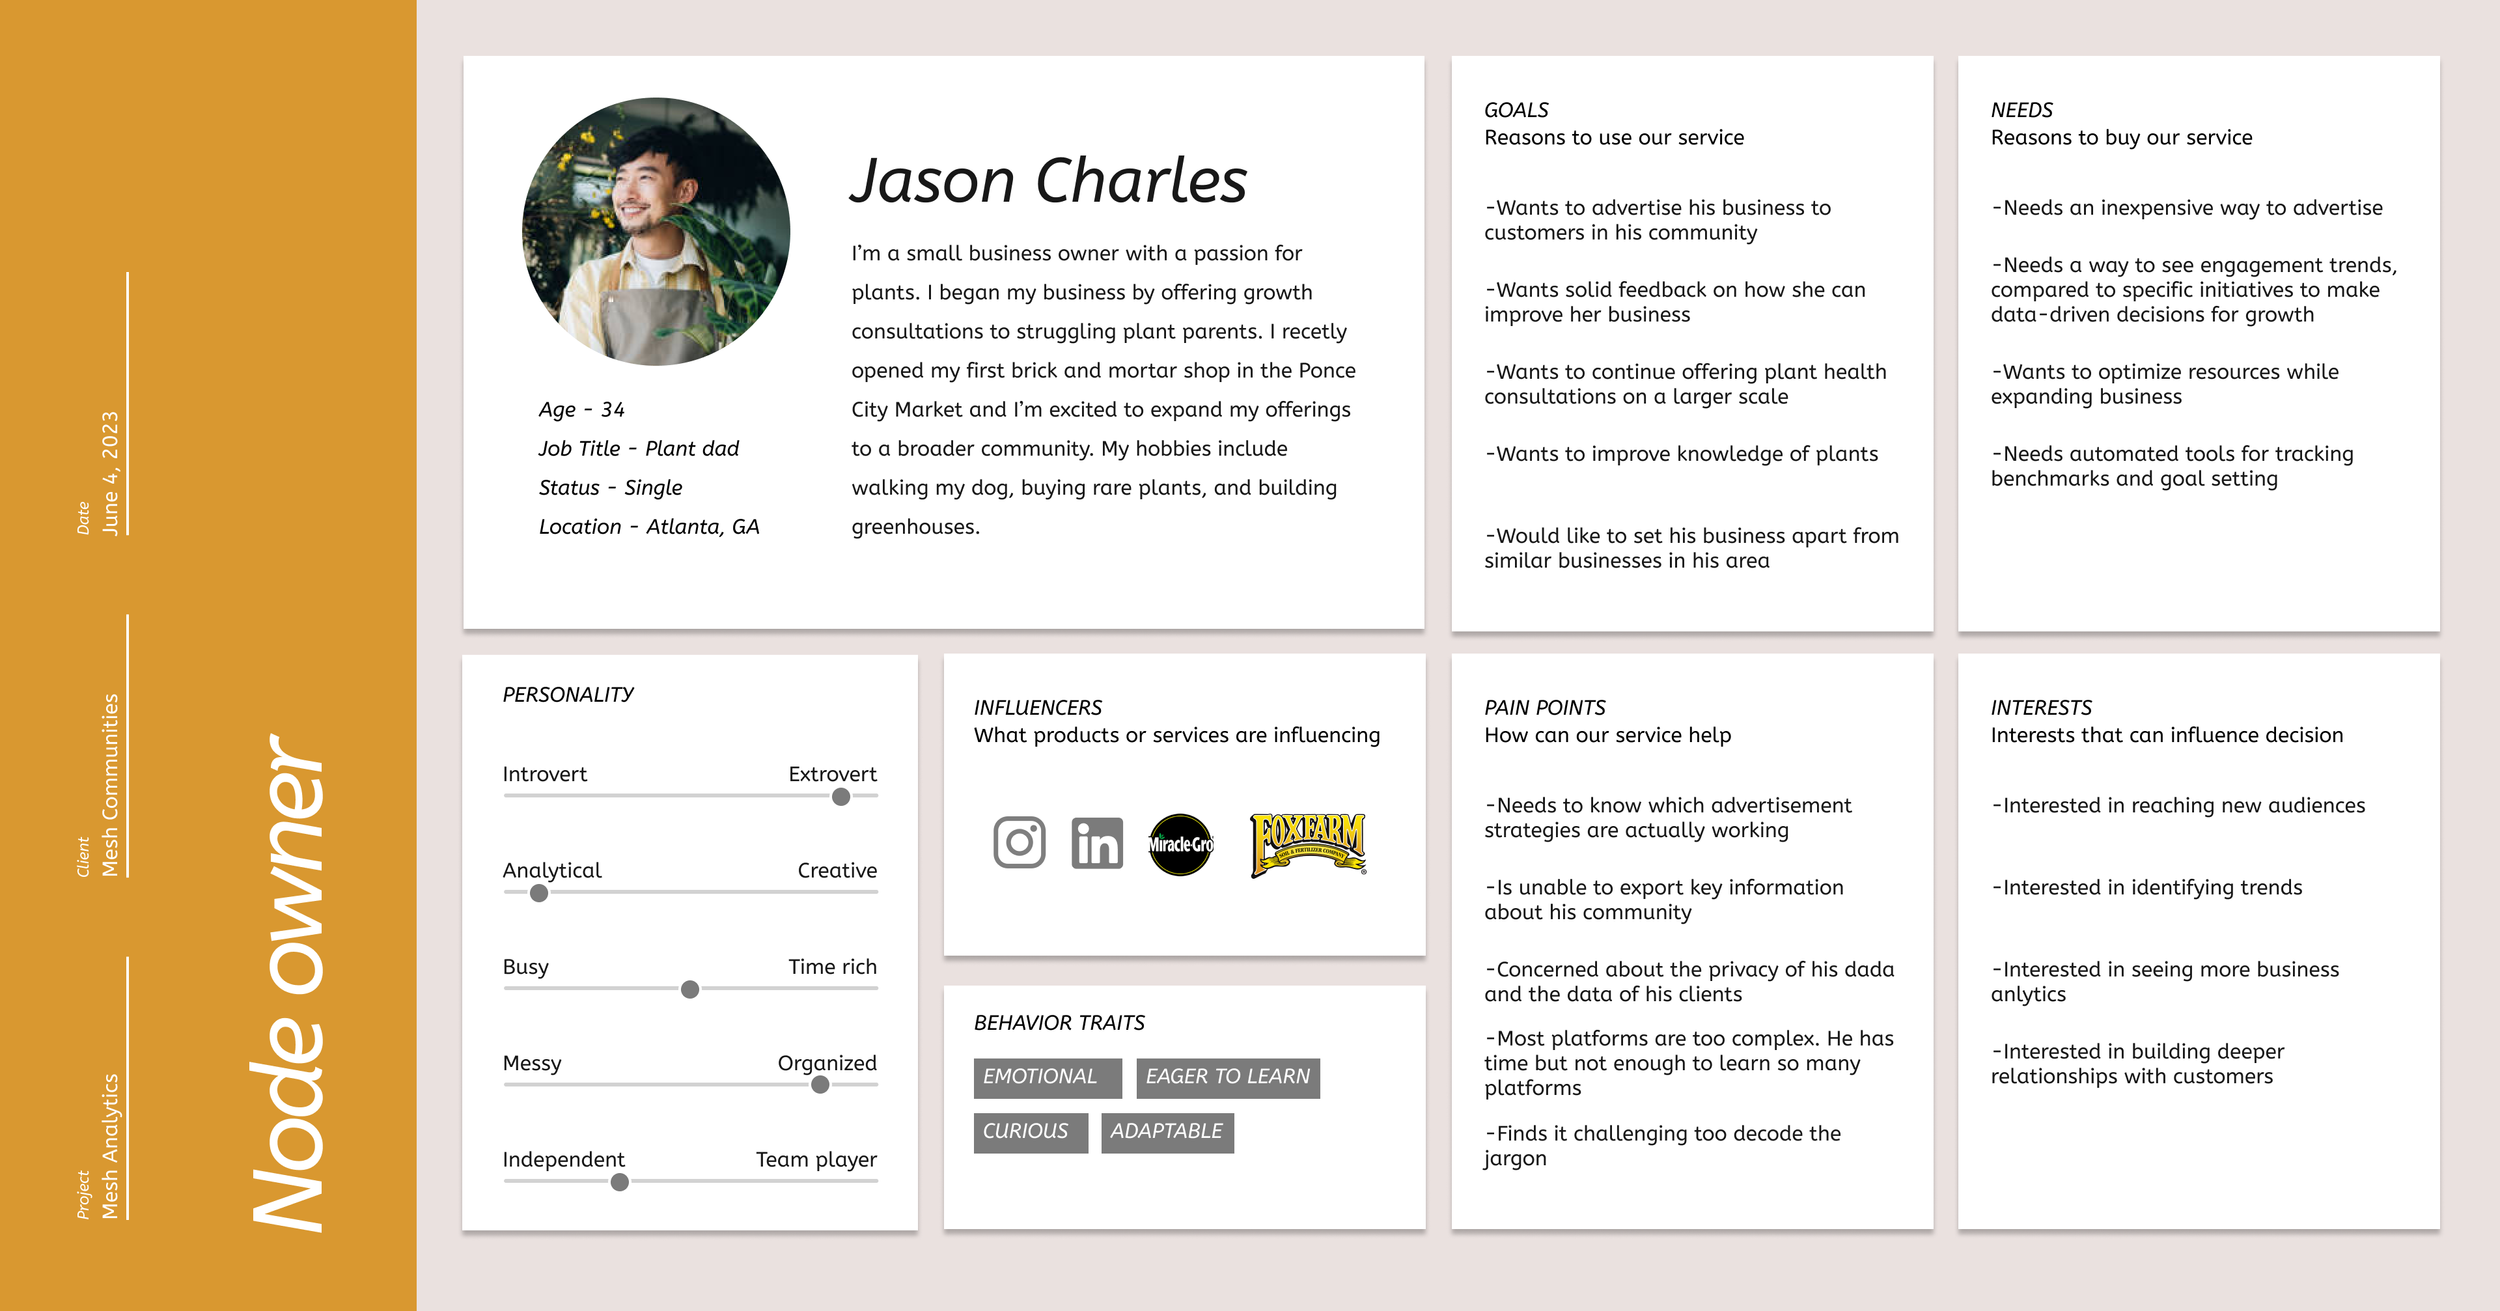
Jason Charles is a 34-year-old small business owner in Atlanta, GA, known as the "Plant Dad." Passionate about plants, he began his journey by offering growth consultations to struggling plant parents and recently opened a brick-and-mortar shop in Ponce City Market. Jason, who is single, enjoys walking his dog, buying rare plants, and building greenhouses. His personality leans towards being an introverted, analytical, and busy individual who is also messy and independent. He is emotional, eager to learn, curious, and adaptable. Influenced by Instagram, LinkedIn, Miracle-Gro, and Fox Farm, Jason's goals include advertising his business within his community, obtaining feedback for improvement, expanding his plant health consultations, enhancing his plant knowledge, and setting his business apart from others. He needs inexpensive advertising methods, tools for tracking engagement trends, resource optimization while expanding, and automated tools for benchmarks and goal setting. His pain points involve understanding which advertisement strategies are effective, exporting key information, data privacy concerns, and the complexity of various platforms. Jason is interested in reaching new audiences, identifying trends, utilizing business analytics, and building deeper customer relationships.
User Personas
Max Irons
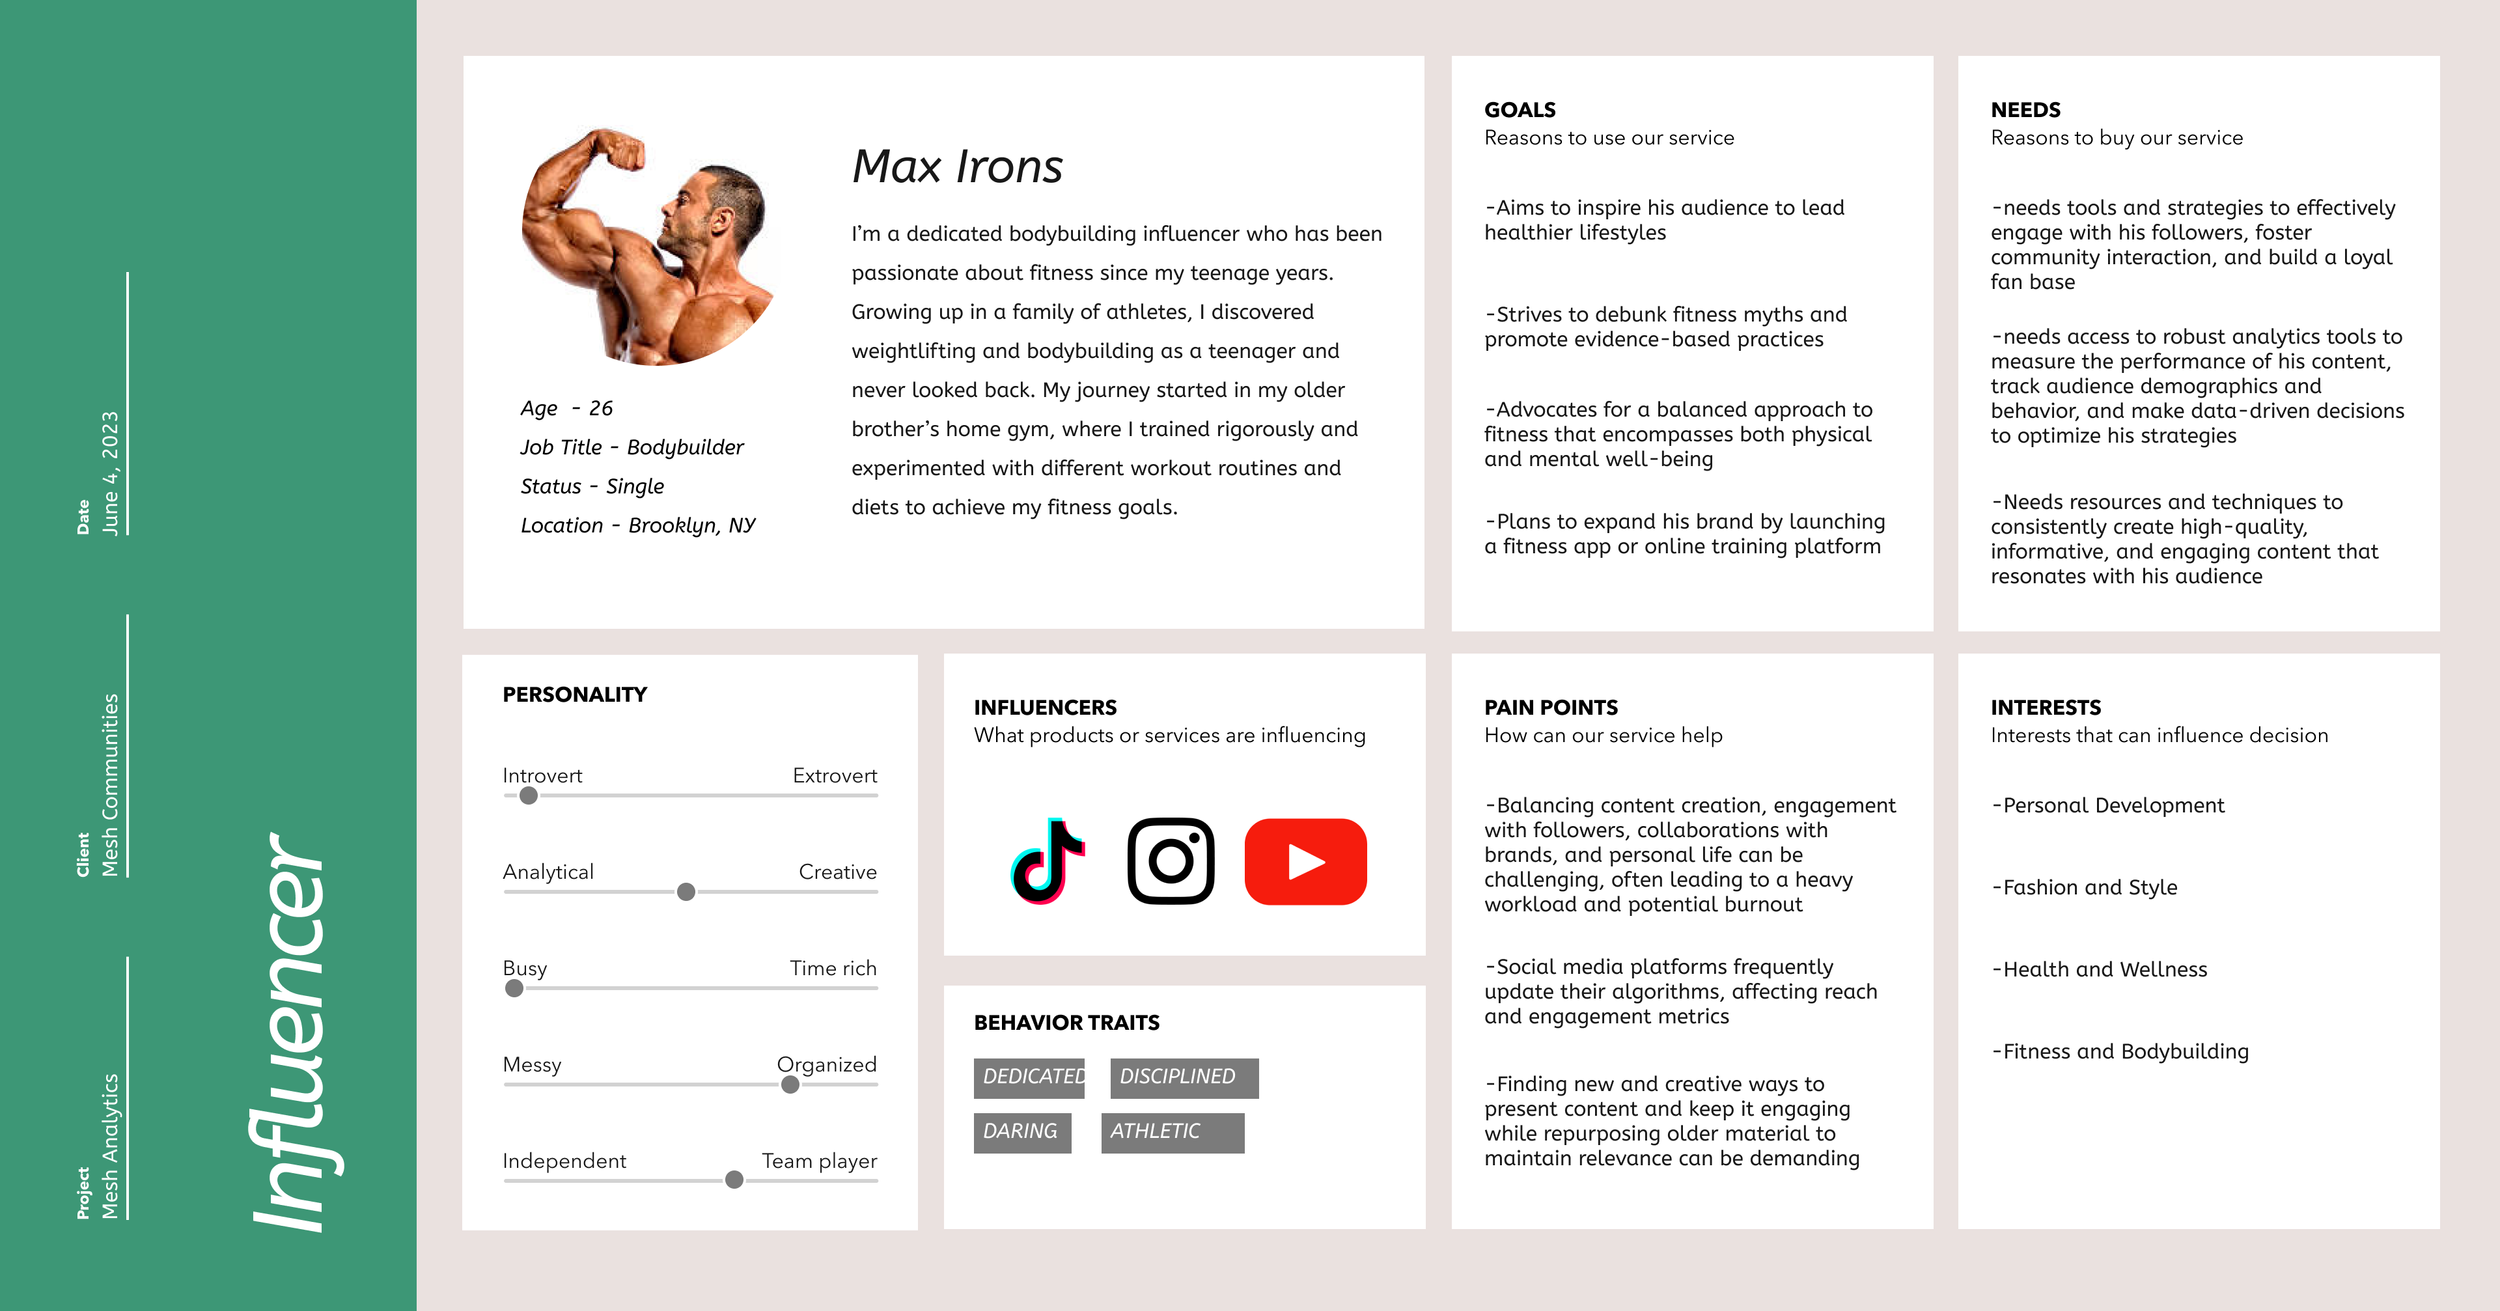
Max Irons is a 26-year-old bodybuilding influencer from Brooklyn, NY, who has been dedicated to fitness since his teenage years. Growing up in a family of athletes, he discovered weightlifting and bodybuilding as a teenager and has pursued it passionately ever since. His journey began in his older brother's home gym, where he rigorously trained and experimented with various workout routines and diets to achieve his fitness goals. As an extrovert with a creative and time-rich personality, Max is also organized and a team player. Influenced by TikTok, Instagram, and YouTube, Max aims to inspire his audience to lead healthier lifestyles, debunk fitness myths, advocate for a balanced approach to fitness, and expand his brand by launching a fitness app or online training platform. He needs tools and strategies to effectively engage his followers, access to robust analytics tools, and resources to create high-quality content. His pain points include balancing content creation with personal life, adapting to social media algorithm changes, and finding creative ways to keep his content engaging. Max is interested in personal development, fashion and style, health and wellness, and fitness and bodybuilding.
User Stories
User story 1
Title: As a small business owner, I want to advertise my business effectively.
Description: Jason Charles wants to promote his plant business within his community to attract more customers and grow his brand.
Acceptance Criteria:
Jason can easily create and launch advertisements targeting his local community.
The platform provides insights on ad performance and engagement.
Advertisement tools are affordable and fit within his budget.
User Story 2
Title: As a business owner, I need to optimize resources while expanding.
Description: Jason wants to efficiently manage his resources as he expands his business to ensure sustainability and profitability.
Acceptance Criteria:
Resource management tools are available to track inventory, sales, and expenses.
The platform offers tips and strategies for resource optimization.
Jason receives alerts or recommendations when resources are being underutilized or overextended.
User Story 3
Title: As a business owner, I want automated tools for tracking benchmarks and goal setting.
Description: Jason needs tools to help him set goals, track progress, and measure success without manual effort.
Acceptance Criteria:
An easy-to-use interface for setting business goals and milestones.
Automated tracking of key performance indicators (KPIs).
Visual reports and dashboards showing progress towards goals.
User Story 4
Title: As a community-focused entrepreneur, I need a way to see engagement trends compared to specific initiatives.
Description: Jason wants to understand how his marketing and community engagement initiatives are performing over time.
Acceptance Criteria:
The platform provides analytics on customer engagement and trends.
Comparative reports show the impact of different initiatives.
Recommendations for improving engagement based on data insights.
These user stories encapsulate Jason's goals, needs, and pain points, providing a clear roadmap for developing solutions that align with his business objectives.
Wireframes

Choose analytics
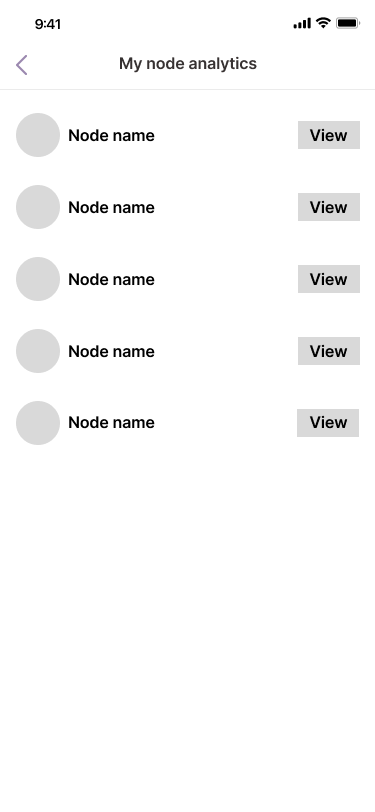
Choose node
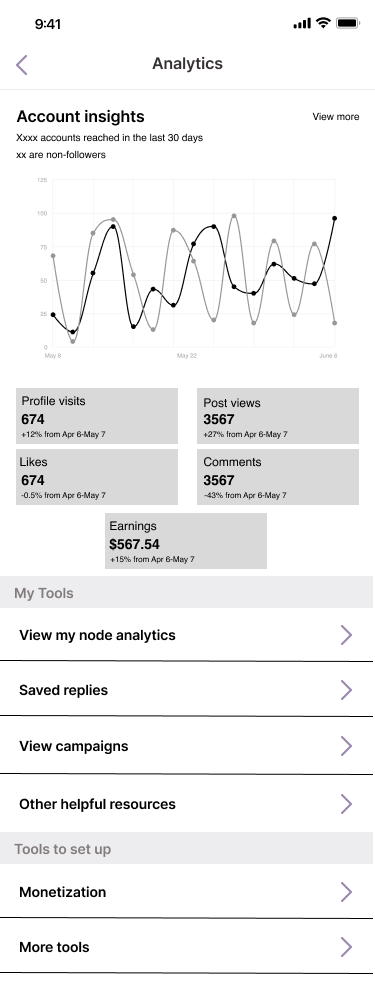
View analytics overview
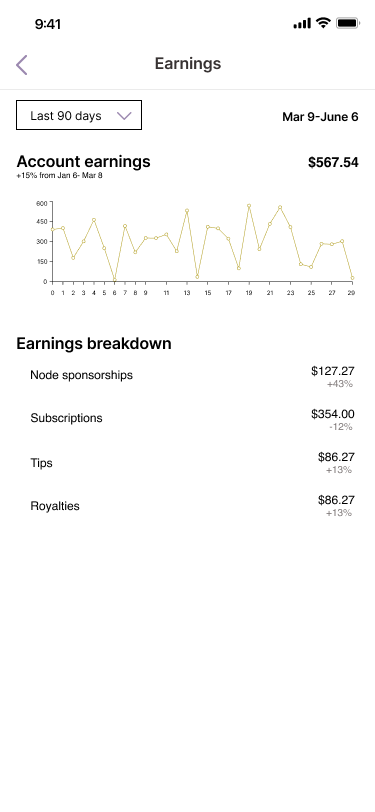
View earnings
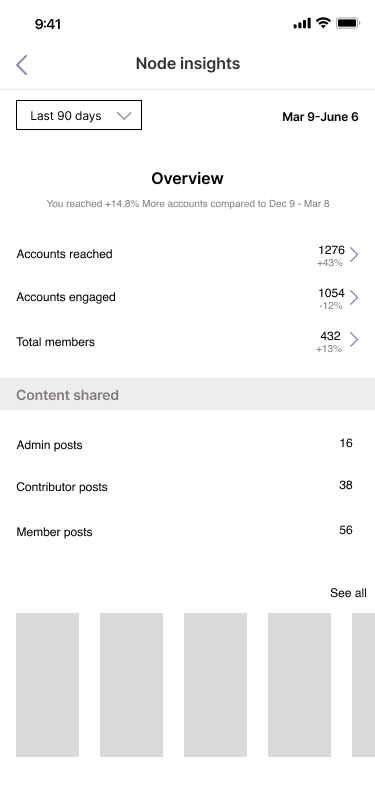
Node insight overview
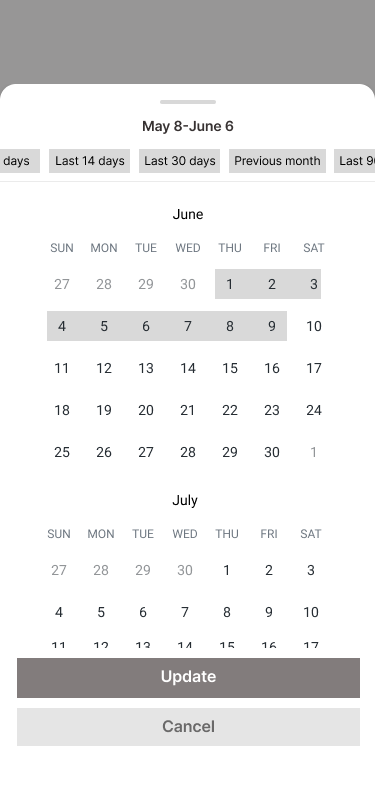
Select date range
Account reach
Account engagement
Followers
Mockups
In accordance with stakeholder requirements, the analytics suite was drilled down to more simplified functionality for V1. This functionality was prioritized in order to accomplish the main goal of giving users a glimpse into their audience.
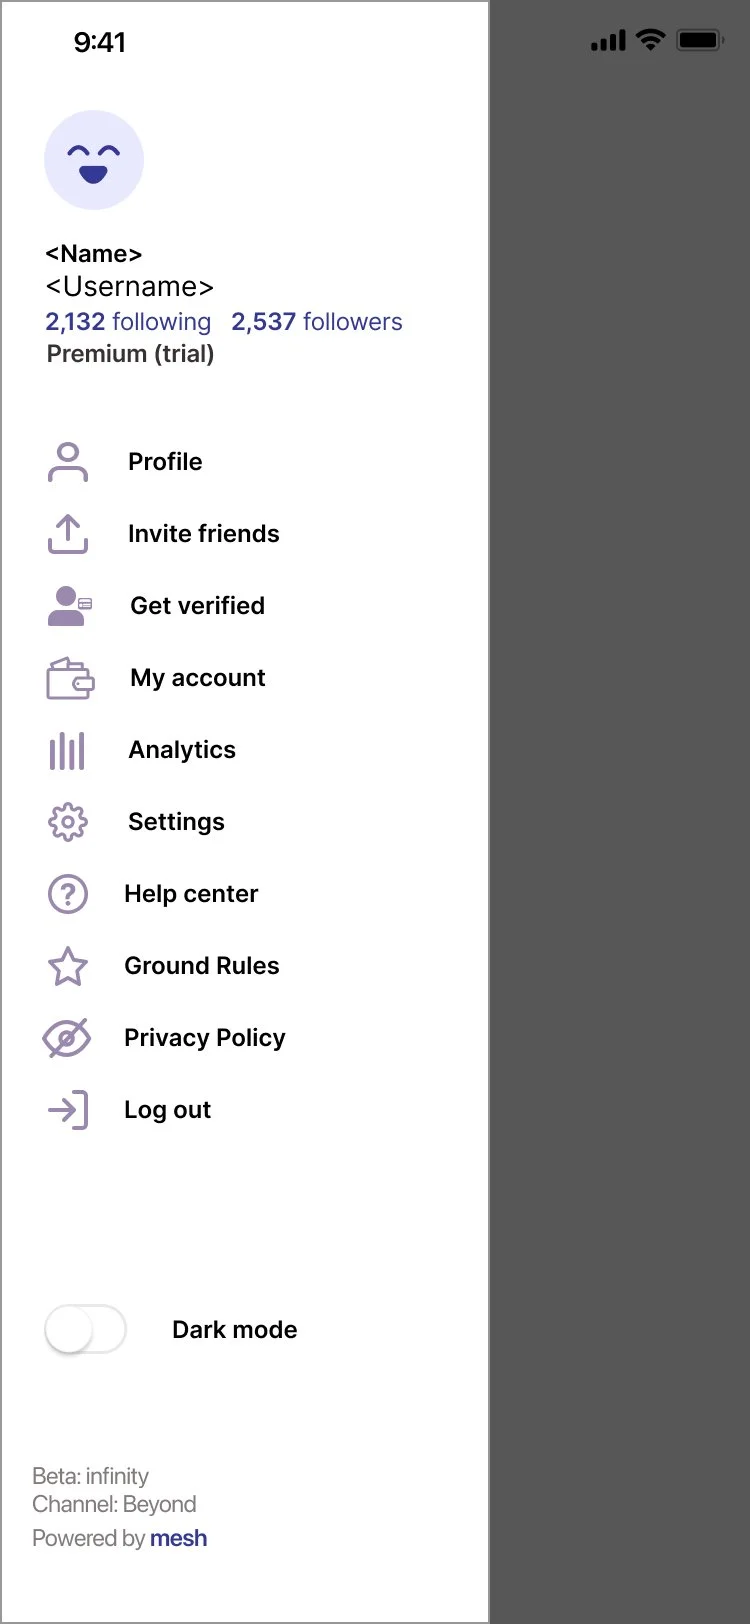
To access analytics, users can navigate to the profile drawer, which will contain a link to view “Analytics”. Once the user taps this link, they will see the profile analytics page, which shows insights for posts they make to their profile and in nodes.
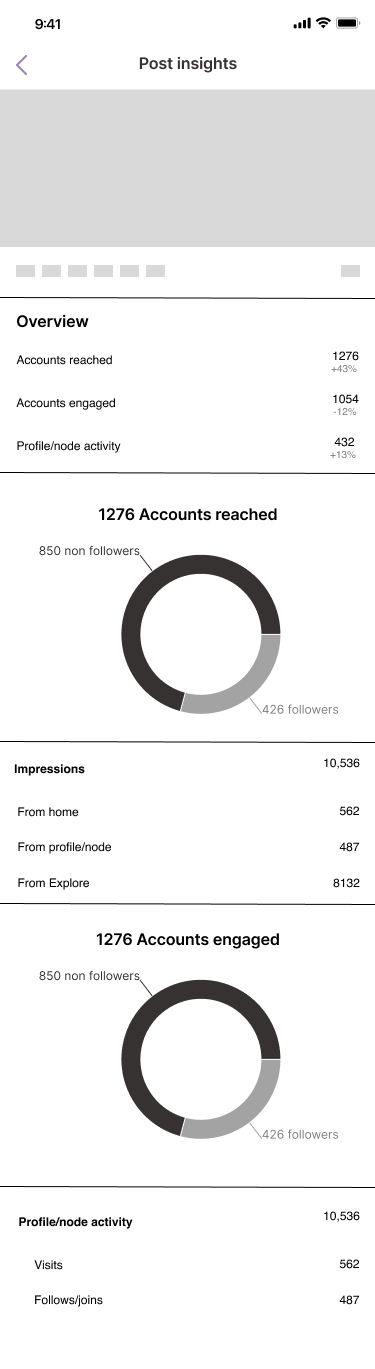
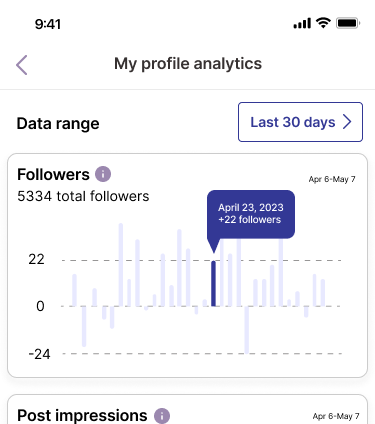
Profile analytics
Node/profile analytics data should appear in an endless scroll that contains key information for the understanding of performance. For v1, we will only be showing the Followers graph and the Post impressions graph. “Followers” will be a total of follows -unfollows for each day, for that instance. “Post impressions” will be the total of the impressions for each day on that instance.
When a data point is selected, the selected point should use the “on topic color” along with a callout box which gives the user more information about the selected point. In the case below, the callout box tells the user that on Apr 23rd they gained 22 followers compared to the (previous day).
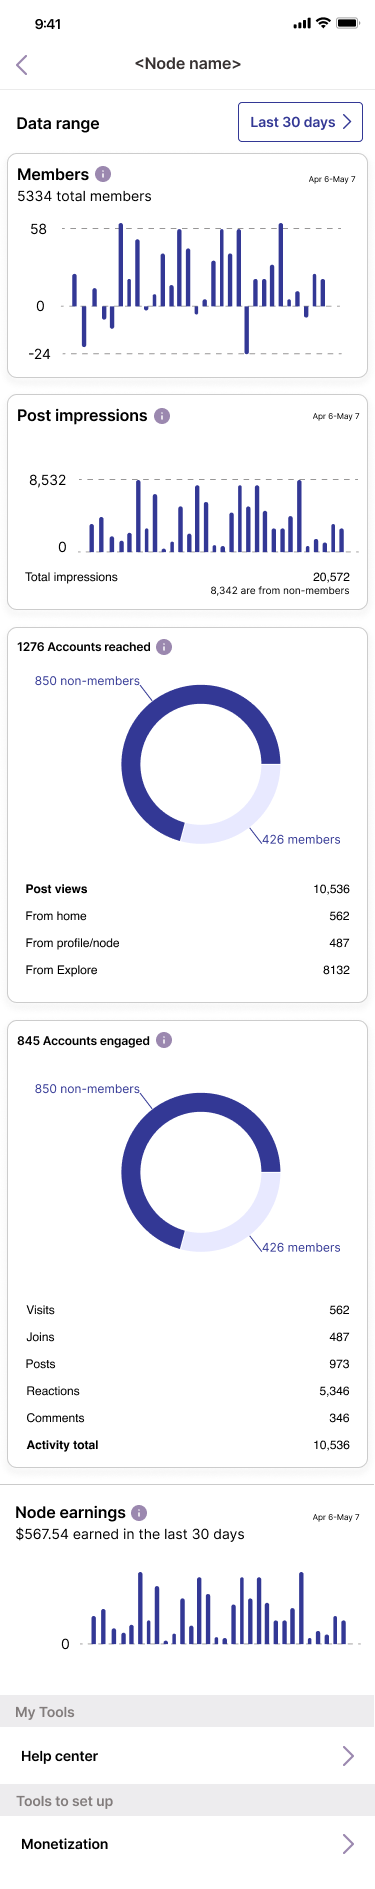
Header information
The page header should indicate which node the user is viewing either by listing “my profile analytics” if the user is viewing profile analytics or the node name if the user is viewing analytics for a node. Below the page header, users can decide whether they’d like to view data for “Month to date” which will only list data for the current month (can be less than 30 days), or “Last 30 days” which will show data for the previous 30 days.
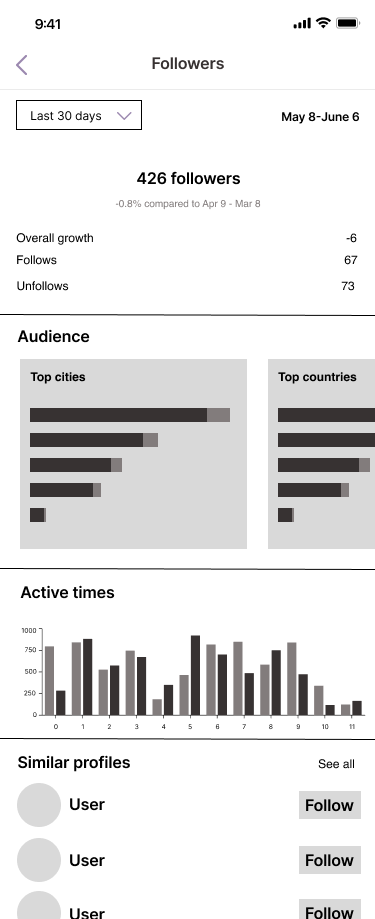
Followers
Within the “node members” or “Followers” section, users can track their growth within the selected period. This tile should list the number of members or followers below the title and a bar graph with a bar for each day within the selected period. Ideally, the graph would also show horizontal lines for the maximum growth and loss for the period. If there is no loss during the period, only the 0 line and positive lines should be displayed. Each tile should also contain tooltips that provide a brief description of the data the user is viewing.
Post Impressions
Next, users should see impressions. This tile should include the total number of impressions for the selected period, how many of those impressions came from non-members/non-followers, and a graph that shows the number of impressions per day. Users should also see the breakdown of impressions by source location.
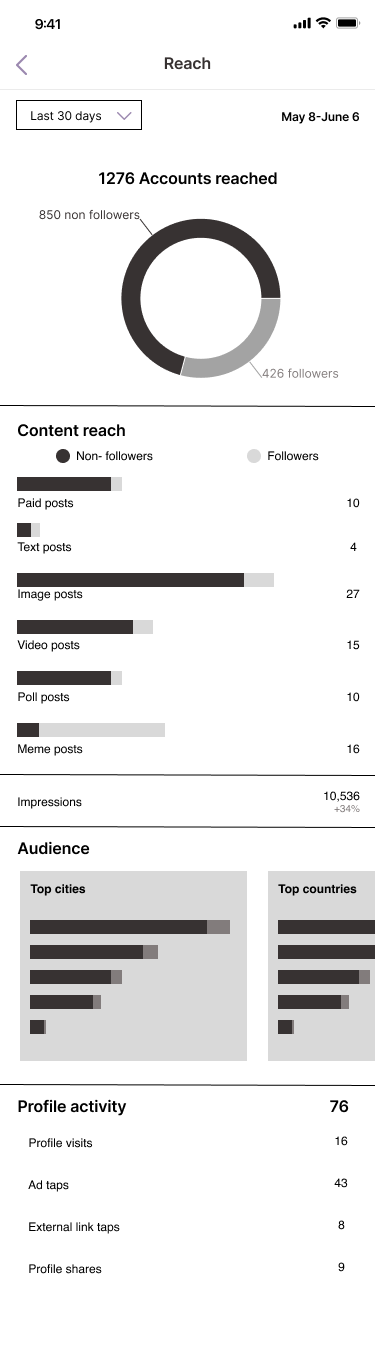
Accounts reached
Accounts reached shows the number of unique accounts that contributed to post views. Reach should be separated into members/followers vs. Non-members/non-followers. Users should also see the a breakdown of reach by source location.
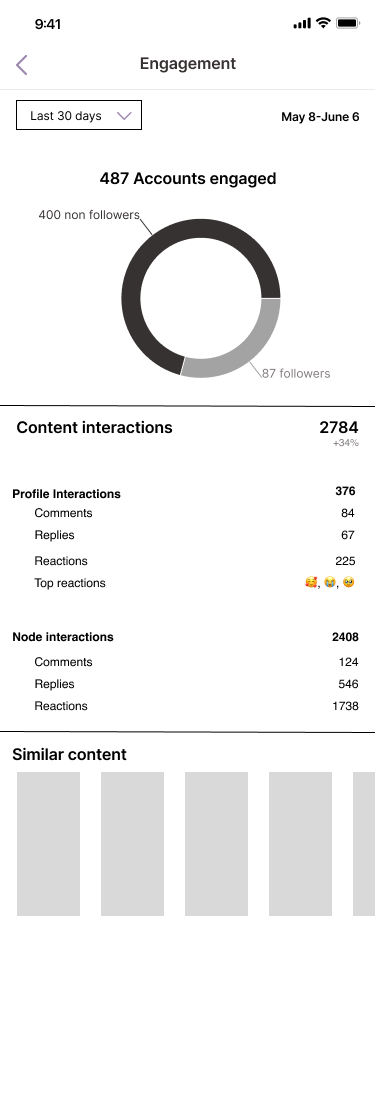
Accounts engaged
Accounts engaged should also be broken down into member/follower vs. non-member/non-follower. Activity should list the total number of engagements with a breakdown of engagement type below. Engagement numbers will be based on
node/profile visits
Node joins/ profile follows
Posts in a node (not counted for profile)
Reactions
Comments
Profile earnings
Finally, earnings should include a bar graph that shows earnings per day. The total number of earnings should be shown, as well as the +/- percentage for the current period, compared to the previous period.
Etc
Below earnings, “My tools” should contain links to helpful resources (like the mesh wiki, tutorials, creator hub, FAQs…) that could help creators and community builders increase their earnings and improve their numbers.
“Tools to set up” would be a temporary category that could contain links to launch any flow that is incomplete but recommended for maximum privileges, such as:
Set up monetization
Verify email or phone number
Create weekly post
Conclusion
In conclusion, the Mesh Analytics dashboard project has successfully addressed critical gaps in the social media ecosystem by providing creators with robust, transparent tools for understanding and optimizing their performance. By tackling the key issues of inadequate moderation tools, lack of monetization opportunities, and opaque data practices, we have empowered creators to take control of their social media presence and maximize their earnings. Through competitive analysis, we synthesized the best features of leading social media platforms, offering a comprehensive and user-friendly analytics suite that demystifies key performance indicators and provides actionable insights.
Our research and user personas highlighted the diverse needs of our target audience, from small business owners like Jason Charles to fitness influencers like Max Irons. By incorporating their goals, pain points, and requirements into the design, we created a tool that not only meets their immediate needs but also supports their long-term growth and success.
The Mesh dashboard's V1 implementation focuses on essential functionalities, offering clear, easily accessible insights into follower growth, post impressions, account reach, engagement, and earnings. This streamlined approach ensures users can quickly understand their performance and make informed decisions to enhance their social media strategies.
Ultimately, the Mesh Analytics dashboard is a significant step forward in empowering community builders and content creators. By providing greater transparency and comprehensive analytics, we are fostering a more equitable social media economy where creators can thrive and be fairly rewarded for their contributions. This project underscores our commitment to supporting the growth and success of creators on Mesh and across the broader social media landscape.